
Score Distributions in OSX, Win10, and Linux
The data we're sharing first is the data from what we refer to as our static analysis. (Fuzzing and dynamic analysis data will be described later). This is the part of our data that is most similar to nutritional facts of software, as it focuses on features and contents of the binary. In particular, what application armoring features are present (and how well were they done), how complex is it, and what does the developer hygiene look like? Each binary gets a "local score", based on just that binary, and a "library score", based on the local scores for all libraries it depends on (directly or indirectly, through other libraries). These two values are combined to produce the total score. The charts below show histograms of the total scores for each of the tested environments.
We have static analysis data on the base installs on all 3 of our initial desktop environments: OSX (El Capitan 10.11), Windows 10, and Ubuntu Linux (16.04 LTS). Since it had come to our attention as an interesting test case, these installs also include Anaconda, the big data analytics package from Continuum. It's important to note that scores don't compare directly between environments. If the 50th percentile mark for Windows is higher than the one for Linux, for example, that doesn't necessarily mean anything. Each environment has different sets of safety features available and different hazards for programmers to avoid, so the score values aren't apples to apples. This is important enough to bear repeating: consumers should compare the ratings we will be releasing of applications against each other *within* a particular environment. What we're focusing on here is the overall distribution and range of scores, as this tells us something about how consistent the development process was for that operating system/environment. So which company appears to have the better Security Development Life Cycle (SDLC) process for their base OS?
We're still finalizing some data before we share reports or scores for specific software verticals, but we can share the overall landscape in each environment. In a near-future blog post we'll add call-outs for specific applications to these charts, allowing comparisons between competing projects. For now, we're just getting the lay of the land. First off, here's the histogram of application scores for the base installation of OSX.
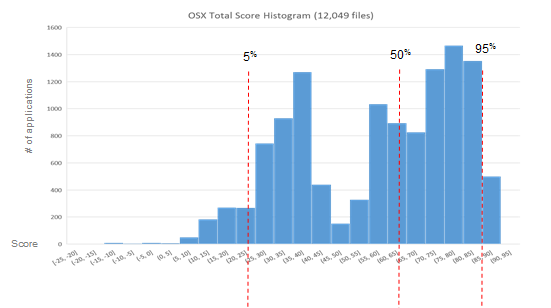
Base OSX has a roughly bimodal distribution, with the scores covering a pretty broad range. The 5th and 95th percentile lines are 67 points away from each other. While there aren't any perfect scores, there's a fair amount in the 90s (100 would be a "perfect score" for this high level static view). [Note: "Perfect score" does not mean secure. Instead, it means that the appropriate safety measures and protective harnesses were enabled in the development process. As an analogy, a car that has seat belts, anti-lock breaks, air bags, active and passive restraints, etc. would receive a "perfect score". We could also call this the "bare minimum", but we're trying to encourage the industry rather than simply berate it. In the future we will release the measurements that show the level of efficacy each of these safety features achieved per application, but for now we are discussing this at a much higher level to help acclimate people to the approach.]
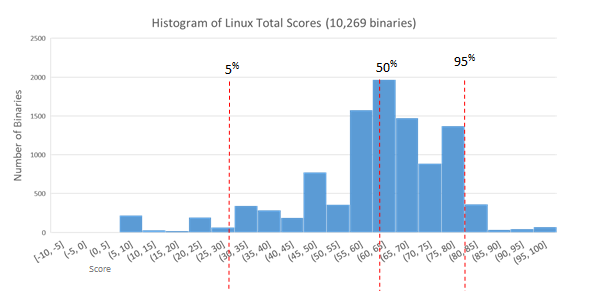
With Linux Ubuntu (16.04 LTS), we still have a pretty broad range of scores, but with a longer tail for the upper range of the scores. Here we have more of a normal distribution. The 95th percentile line moves down a bit, but the other percentile marks are surprisingly close to the values in OSX.
With Windows, we have a very different picture. Frankly, this is very impressive:
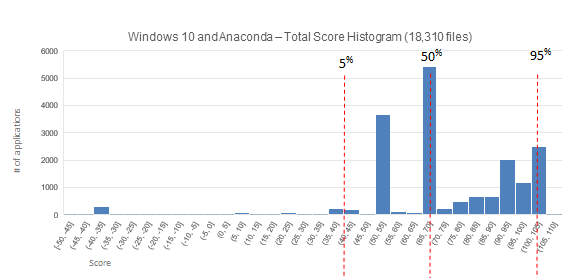
Windows shows a pretty different chart from the previous two. The bin for scores from 65-70 has about 5500 files in it. Even accounting for the increased number of files in the Windows base install, this is much higher than the biggest peaks on either of the other charts, indicating that application of armoring and security features is much more uniform for the Windows environment. Windows also has many more files with a perfect or near-perfect score than OSX or Linux had. While all three environments had the potential for a final score to be slightly over 100, this is the only environment to have any in practice.
This distribution will become a lot broader once we bring in third party applications. This prediction is supported by what Anaconda's presence already does to the chart. Namely, it contributes the lowest 450 or so scores to the chart, including everything scoring a -22 or lower. [Note: Continuum, the company that packages Anaconda, is aware of these findings. Should they decide to move to a modern development with a full complement of safety features available (and frequently enabled by default), their scores will improve significantly. We are hoping they do so, as their current product imposes significant risk on their customers, and it would be a great initial win if this got fixed. We will keep you posted on this topic.]
We are installing a wide variety of third party software onto our test systems. This will provide an understanding of the overall software ecosystem for each environment. More importantly, though, it'll allow consumers to call out all members of a particular software category and compare them based on where they fall on this safety continuum.
With this information it will become a straight forward process to choose and use software that increases the cost to the adversary, and thus measurably decreases the risk to yourself. After all, who would want to install and run the easiest target software for no reason?